US equities recovered swifty from early August’s panic selloff and regained their footing as optimism stemming from the anticipation of looser financial conditions from the Fed, once again took the helm. In this report we aim to present and analyse the latest fundamental drivers and economic developments could impact the performance of US equity markets and conclude with a technical analysis of the S&P500.
Equities report
Monetary policy backdrop
Later on today, the main event of the day and possibly the week, the Federal Reserve’s policy decision for September, will take place and the market is increasingly gearing up for the announcement, but also for the commentary for FOMC and any forward-looking data scattered in the accompanying statement.
Economists foresee that the central bank will officially pivot towards looser financial conditions in September and slash its key policy rate after 4 years, reducing the funds rate from the 5.25-5.5% level, a 23-year high, as inflation moderated substantially, and upside risks have almost been suppressed. Speaking of inflation, the latest annual CPI reading recorded its 5th straight month decline to the 2.5% level in August, the lowest reading in 2021, and Core PCE, the Fed’s favorite inflation gauge, hovers at 2.6% according to July’s data. The core CPI stands at a three year low of 3.2%.
Currently, it appears that there isn’t much of debate of whether the Fed will cut rates, it is seen as been inevitable, but rather the conversation revolves around the magnitude of the reduction. Money markets participants are favoring a larger 50bps rate reduction today and assign a 63% probability for this scenario to materialize (putting more emphasis on the recent labor market distress signs rather than inflation), whereas the headline expectations from polled economists favor a moderate 25bps, sidelining with the Fed’s baseline or priorly observed decision-making process.
Onwards, markets see a follow-up 25bps cut in November and another ‘jumbo’ 50bps cut in December, leaving an implied terminal feds fund rate of 4-4.25% by years end. Needless to say, the reality check will be provided by the FOMC’s updated dot plot graph, which would somewhat telegraph their intentions going forth, but also for the updated inflation expectations.
Should the central bank opt for a decisive kickstart of its campaign by opting for a ‘jumbo’ rate reduction, will most likely give the definitive green light to equity traders and spark a fresh wave of strong capital allocation in riskier assets.
BlackRock-Microsoft AI team-up
Earlier this week, BlackRock, the world’s largest asset manager announced its plans to tackle the mismatch of demand and supply dynamics of the rising force of Artificial Intelligence sector, by creating an AI investment-focused fund of more than $30B, recognizing the dire need and importance, of the advancement of technological innovation and the long-term opportunities a solid AI infrastructure could yield.
The asset manager chose to partner up with Microsoft, the information technology giant, with the joint heavyweight forces seeking to invest in AI infrastructure via the dubbed, Global AI Infrastructure Investment Partnership (GAIIP) vehicle created by BlackRock, to scale up the supply of AI driven solutions to the market. The partnership’s investment focus will be primarily targeted towards the development of data centers and the creation of a sustainable energy infrastructure grid that could effectively support the operations across North America, aiming to enhance at the end of the day, the US competitiveness in the global AI race.
The partnership is expected to become one of the largest investment vehicles ever in Wall Street, an event that could fuel the rise of AI-related corporations across the US and drive ludicrous valuations even higher. The collaboration will initially seek $30B via numerous private equity capital raises over time and has the potential to amass up to $100B in total investments including debt financing.
Equities Análise técnica
SP500 Daily Chart
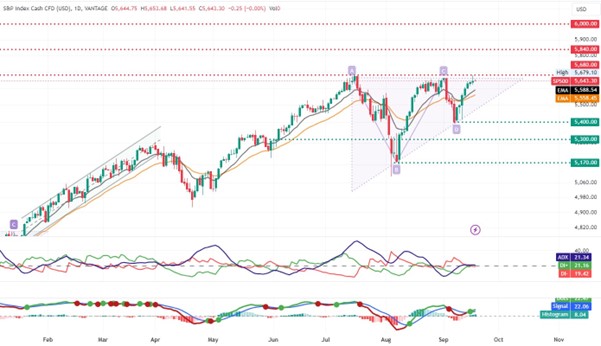
- Support: 5400 (S1), 5300 (S2), 5170 (S3)
- Resistance: 5680 (R1), 5840 (R2), 6000 (R3)
Looking at SP500 Daily chart we observe the index escaping from its short-lived technical correction and rising yet again to challenge and break into record high territory.
We hold a bullish outlook bias for the stock market index given the ascending triangle, which highlights the two consecutive higher lows formed since August and flirting of price action with the twice tested $5680 (R1) resistance barrier. The consolidation and the maintenance of the price action above both the 12 and 26 EMAs, validates our call, alongside the recent crossover of the signal line above the MACD line and the histogram maintaining a positive value.
ADX however, gives out mixed signals currently, with neither the +DI or -DI having a substantial enough difference, and at the same time the ADX somewhat flatlining around the threshold, implying stagnation of momentum.
A strong catalyst, much like today’s Fed decision could spark a rally should the result is sufficiently dovish. Should the bulls create enough momentum, we may see the index breaking definitively past the 5680 (R1) resistance ceiling and head for the 5840 (R2) resistance barrier.
Should on the other hand, selling pressure aggravate and the bears gain control, we may see the break below the lower bound ascending channel and the index finding support at the $5400 (S1) support base, or possibly lower near the $5300 (S2) area.
AVISO LEGAL: A informação disposta não deve ser interpretada como consultoria financeira ou recomendação de investimento, sendo apresentada apenas para fins de comunicação e marketing.