The bullion has been gyrating aimlessly near its record highs over the four three weeks, as a streak of mixed economic data releases on various fronts, nudged traders to stay in the sidelines, favouring caution. An inbound inflation print later today however, runs the risk of creating undue volatility and create opportunities for traders, since its results have direct implications on the Federal Reserve’s policy plans in its last three meetings of 2024. In this gold report we aim to shed light on the catalysts driving the precious metal’s price, assess its future outlook and conclude with a technical analysis.

Labour market’s cooldown signals
The gold upon the steadfast fall of bond yields and the greenback mid-August and rose to fresh all-time highs as traders favoured the safe haven asset, after July’s NFP print broadcasted the impediment of the US job creation mechanism and that the prolongment of the current monetary regime from the Federal Reserve, will inevitably bring undue harm on the US economy.
Thus, money market participants rushed to assess that a pivot towards looser financial conditions appears to be the only path forward from the central bank in order to steer the economy from plunging into a recession.
Expected cooldown of US CPI print to set in stone Fed cuts
All eyes are expected to fall onto the latest US inflation print for the month of August as we are steadily edging closer to the decisive interest rate decision of the Fed’s September meeting, where traders are increasingly bracing themselves for the central bank to officially kickstart their race towards looser financial conditions, after a year of austere monetary policy conditions.
According to expectations, polled economists see headline inflation sliding to the 2.5% area in the month of August, down from the 2.9% reading of the prior month and record its lowest reading since March of 2021, marking its 5th straight month of easing.
Subsequent and incremental drops in oil prices in recent months seem to favor such call, according to analysts’ forecasts. The Core rate however, which excludes food and energy prices, is seen taking a breather and standing still at the 3.2% level, a development which could be quasi-problematic.
In the scenario where inflation softens at a faster pace than what forecasters expect (both headline and core rates) we wouldn’t be surprised to see, bolstered bets for a jumbo 50bps rate cut by the Federal Reserve at the FOMC meeting next week, and embark resolutely its journey towards easier monetary policy conditions, in order to safeguard the US economy from falling into a recession (given the worries for a weakening labor market).
Under such occasion, gold is reasonably expected to climb higher and break free into fresh historic highs, whereas more pain shall be expected for the greenback, heading into an area last seen before in January of 2024. Less restrictive monetary policy, or at least the expectation, benefits the shiny metal by reducing the opportunity cost of holding non-interest-bearing bullion.
Should on the other hand, in the unlikely scenario where inflation stands pat or even rises from last month’s 2.9% area, we would reasonably expect money market participants, downplaying the 50bps cut and instead favor the smaller 25bps cut scenario.
In the event where we observe a surprise acceleration (possibly due to sticky core services inflation), we would reasonably expect to see the dollar recuperate some of its monthslong losses and gold pulling back from record levels.
Currently, money market participants are pricing in with a 67% certainty that the central bank will go for the smaller, 25bps magnitude, cut next week (with the rest favoring the 50bps) and reduce the federal funds rate from 5.25-5.5% to 5-5.25%.
Onwards, traders bet that a 50bps will follow in November (92% probability) and additional 50bps in December (60%), for a total of 125bp of rate reductions, which leaves an implied refinancing rate of 4.25% at years end.

Gold Technical Analysis
XAUUSD H4 Chart
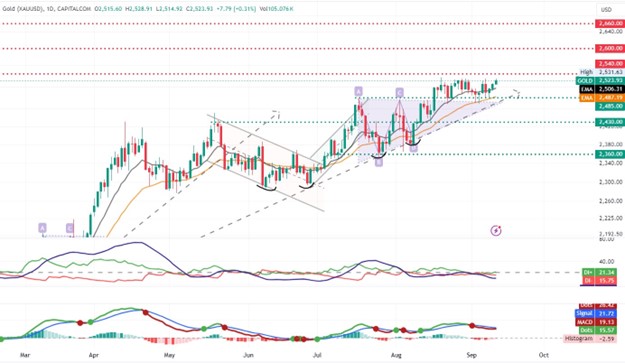
- Support: 2485 (S1), 2430 (S2), 2360 (S3)
- Resistance: 2540 (R1), 2600 (R2), 2660 (R3)
Looking at XAUUSD Daily Chart we observe the precious staying close to its record highs, entering a consolidation phase between $2485 (R1) and $2540 (S1) since the 19th of August and momentum thinning out, as traders await for a catalyst.
We hold a sideways gold outlook bias for the commodity given the prolonged consolidation phase, however we stand ready to adjust our bias from sideways to bullish, should we observe the commodity breaking definitively and decisively above the $2540 (R1) resistance barrier, keeping at the same time the ascending trendline incepted since March of 2024, intact.
Currently, the ADX index below our chart showcases that the bulls are marginally in control (+DI at 21), however momentum is basically absent, indicating that it would require a lot of buying activity to create volatile enough trading conditions and fast price action. The maintenance of the price action above particularly the 12EMA and subsequently the 26EMA, but also the consolidation above the $2485 (S1) former record high, is what gives us enough confidence to consider the possibility of a bullish call.
Should, the bulls stay on top and start piling in long orders and the bears stand pat, we may see the precious breaking past the $2540 (R1) resistance barrier and head for the $2600 (R2) projected resistance area. Should on the other hand, the bears find enough resolve and pile in short positions, we may see the definitive return of the commodity below the $2485 (S1) former all time high spot which now acts as support, and head for the $2430 (S2) support base.
Disclaimer: This material is for general informational & educational purposes only and should not be considered as investment advice or an investment recommendation. T4Trade is not responsible for any data provided by third parties referenced or hyperlinked, in this communication.