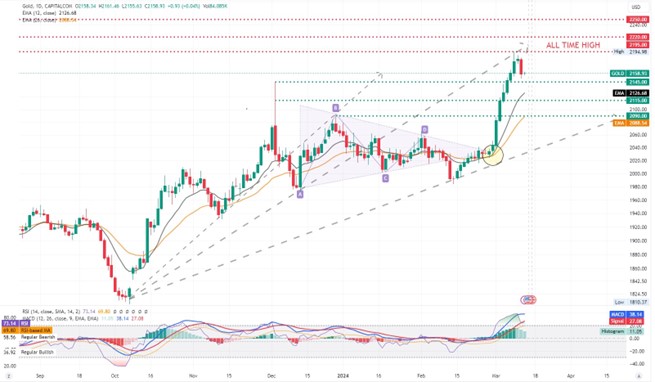
The precious metal (gold) recorded an impressive 8% gain since the start of March, with bulls propelling the safe haven commodity to fresh all-time highs. Since the word on the street has the Federal Reserve abandoning definitively its tightening campaign halfway through 2024 and instead embark on an aggressive streak of rate reductions, as the inflation battle is deemed over. The latest US CPI print however, told a different story.
In this report we aim to shed light on the catalysts driving the precious metal’s price, assess its future outlook and conclude with a technical analysis.

Eye-catching gains
Gold’s performance has been the eye-catching mover of last week, as the precious metal managed to break past the former record high of $2145 and ventured effortlessly into all-time high uncharted territory.
The bullion has been on an impressive 9-day winning streak, as the bulls flood the market with bids, eager to push the commodity’s price even higher, yet the momentum has worn thin from a technical standpoint. It is unclear which factor contributed the most to the impressive rally, but some economists extrapolate that the Fed’s policy pivot plans have been the main driver, whereas others note the weakness in bond yields did the trick. Both indeed, are valid reasons that could explain the move, but only partly.
Another reason which may have contributed to the asymmetric price appreciation may have been the increased demand and subsequent purchases by central banks, who have been on a shiny metal shopping-spree over the past few months or the fact that increased geopolitical tensions may have nudged big players to allocate more funds in the safe haven commodity in fears of impending doom and gloom.
Nevertheless, from an economic perspective, the fact that the market has been beating the drum of policy easing since the start of the year, and money market players positioned themselves for aggressive rate reductions may have been the golden catalyst.
‘Hot’ CPI print dilutes slightly rate cut expectations
The latest CPI update yesterday, showcased that Inflation in the US failed to meet expectations and came in hotter than estimated on both the headline and the core fronts. More specifically, the headline rate up ticked from 3.1% to 3.2% whereas, the Core rate, which excludes volatile food and energy prices, eased at a slower pace, only by a tenth of a percent, down from 3.9% to 3.8% level, but ultimately above the 3.7% expectation for a slowdown.
The results indicate that inflation is having much harder time than what the market anticipates, showcasing its stickier nature, and given its trajectory, it indirectly validates various Fed policymakers’ warnings and projections, who note that rushing to cuts rates prematurely is not the appropriate course of action. At the time of the release, no changes were observed in money markets, yet as the data settled in, market players dragged their feet and diluted projections for rate reductions in 2024.
Despite the June meeting remaining still the prominent case for a policy pivot, economists now see two additional rate cuts by years’ end, instead of three, taking place in the meetings of September and October, with the December meeting falling out of favour, for the time being.
Thus, a total of 75bps of rate cuts are foreseen for now, leaving a feds target rate of 4.75% by years end. As expected the USD found support and ground under its feet post the release, alongside bond yields, whereas gold on the other hand, shed 1% of its value and headed south from its recent on time high peak, due to the inherent negative correlation it possesses with yields and the greenback, setting an end to its impressive 9 session-long rally.

Gold Technical Analysis
XAUUSD (Gold) Daily Chart

- Support: 2145 (S1), 2115 (S2), 2090 (S3)
- Resistance: 2195 (R1), 2220 (R2), 2250 (R3)
Looking at the (gold) XAUUSD Daily Chart we observe the precious breaking past the former peak at $2145 and rally with strong momentum on its side, as high as the $2195 level which now serves as the new ATH level. We hold bullish outlook bias for the commodity given the outsized move, yet the recent drop but also the formation of an evening star pattern at the top, complicates matters further and may force us to alter our assessment to sideways upon further evidence.
The fact that the RSI reading hovers above the 70, overbought level, signifies that the bullish momentum is strong yet is loosing traction, and the MACD indicator below our chart also validates that the bulls are in control of the move. Should the bears find enough resolve, recognise and act upon the formation of the evening star pattern formation we may see the definitive break below the $2145 (S1) former all time high spot which now acts as support and head for the $2115 (S2) support base.
Should on the other hand, the bulls stay on top and hold onto the initiative, we may see the precious recuperating yesterday’s losses, break past the $2195 (R1) recent peak and head for the $2220 (R2) uncharted resistance barrier.
免责声明: This material is for general informational & educational purposes only and should not be considered as investment advice or an investment recommendation. T4Trade is not responsible for any data provided by third parties referenced or hyperlinked, in this communication.


